Traditional data table formats can be overwhelming, but you can use Domo to call attention to the areas that require attention. Here’s how to build a colorful data table in 3 easy steps!
Back in early 2016, we wrote a post about how to use conditional formatting in Domo to apply colors to various cells in a table card. But since 2016, Domo has made a lot of great updates to their product, and one of which is the introduction of color rules. In this post, we will show you how you can use some of the updated features in Domo to achieve the same results (including a colorful data table!), without having to deal with any HTML, CSS, or SQL.
Oftentimes, when a person is viewing data in a table format, it can be overwhelming to see rows upon rows of data, and people can struggle to be able to decipher which specific rows, columns, and/or cells require their attention. We recommend using conditional formatting in Domo to help call attention to areas where the data is significant in terms of your company’s business conditions.
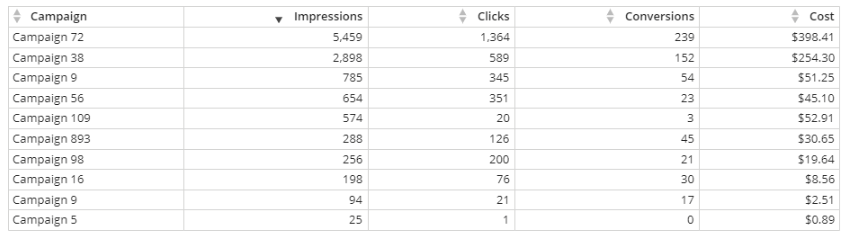
For an example, let’s use some basic Google Ads data and take this table from drab to fab with a few simple adjustments.
Step one for conditional formatting in Domo/ conditional formatting with colors:
Determine the metrics and the specific conditions for those metrics that users should focus on. In this example, let’s assume that the number of conversions is the key indicator of how successful a campaign has been. Specifically, we want to know anytime the number of conversions is less than 10 or greater than 200. We also want to see when the total number of clicks for a campaign is below average.
Step two for conditional formatting in Domo/ conditional formatting with colors:
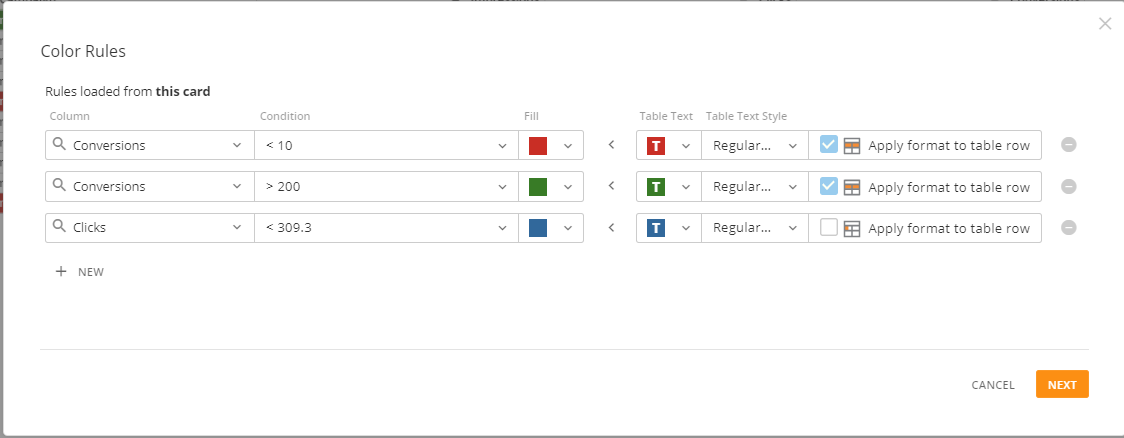
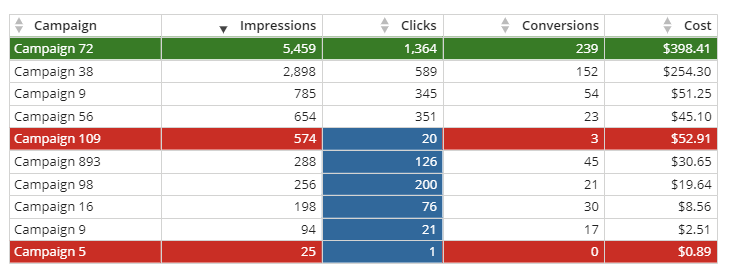
Within your Domo table, navigate to the Color Rules section. You will see that within the color rules section, you can configure your table to display certain colors based on conditions for specific columns. Based on the conditions listed above, our color rules configuration would look like the below. This configuration will cause any rows to be highlighted in either red or green based on the value in the conversions column. This configuration will also cause the cells where the clicks are below average to be highlighted in blue.
Step three for conditional formatting in Domo/ conditional formatting with colors:
After you enter in your logic for the color rules, you will notice that Domo gives you the option to apply those color rules to only the current card you are editing or to all cards. We recommend using the later option when the metrics you applied color rules to will be used on other cards on your dashboard. Choosing this option will ensure you have standardized color rules applied to any instance where the condition is met, which makes for a more seamless user experience.
To summarize, within Domo, you can use the color rules in the following ways:
- Set the color of an entire row based on the conditions of a specific column.
- Set the color of a cell based on the conditions of a specific column.
- Modify the table text or the text style of an entire row or a cell based on the conditions of a specific column.
Without doing any beast modes or knowing any HTML or CSS, you can take your table to the next level and easily highlight metrics that end-users should focus on.
Additional BI Resources:

.png)