If you’re new to Google Analytics 4, validation can be very intimidating (especially for mobile apps). Some of you might even be tempted to have your development team deploy your Analytics code to live users so that you can just review the captured data… don’t do that! This post will give you all of the tools you need to QA your Google Analytics 4 tags in a DebugView (or test version) of your app or website using Debug Mode.
What tools will I need?
Let me start with some good news: you shouldn’t use a proxy like Charles or Fiddler to validate GA4. These are okay for validating websites, but they really are not helpful at all for mobile apps. Instead, Google Analytics 4 provides a special report called DebugView that should be used for QA. To enable DebugView on each platform, you’re going to need to install some software:
- Websites: The Google Analytics Debugger Chrome Extension
- Android Apps: Android Studio
- iOS Apps: An iOS device (like an iPhone or iPad)
So What Is DebugView and Debug Mode?
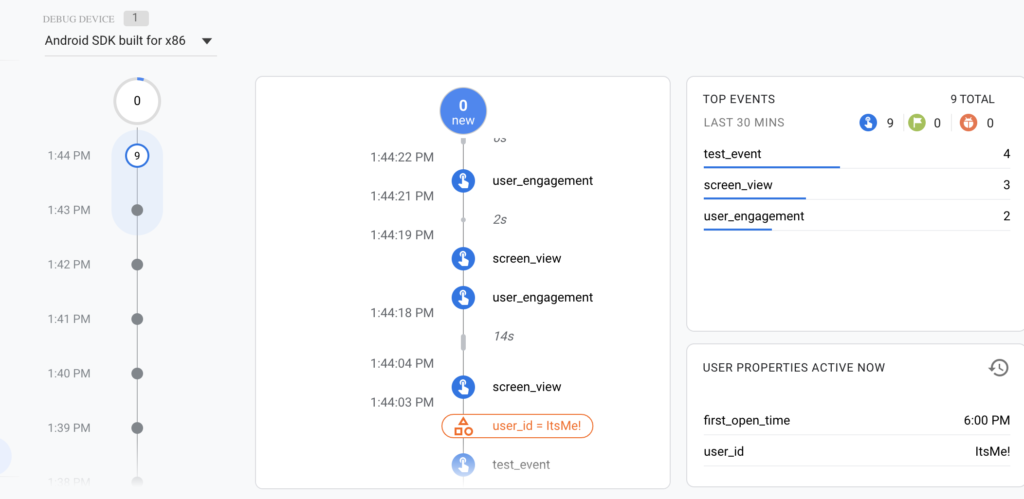
In short, DebugView is a real-time report that allows you to isolate the events, parameters, and user properties that are flowing in from a specific device where Debug Mode has been enabled.
Without Debug Mode, GA4 will batch your events together and send them across the network in bundles (which is part of the reason you shouldn’t use a proxy), but when Debug Mode is running, your data will be sent immediately as you run tests on your app. Also, data captured while Debug Mode is running will be filtered out of your other reports so that it does not artificially inflate your metrics (in other words, no more separate GA properties for production and staging).
TIP: Before you send over implementation requirements to your development team, you should always create tests to show how we will use DebugView to validate that each event/property/user parameter is setting correctly.
How to Enable Debug Mode on a Website
If you’re using Google Analytics 4 on a website, it’s effortless to enable debug mode. All you have to do is install the Google Analytics Debugger Chrome extension and flip it on.
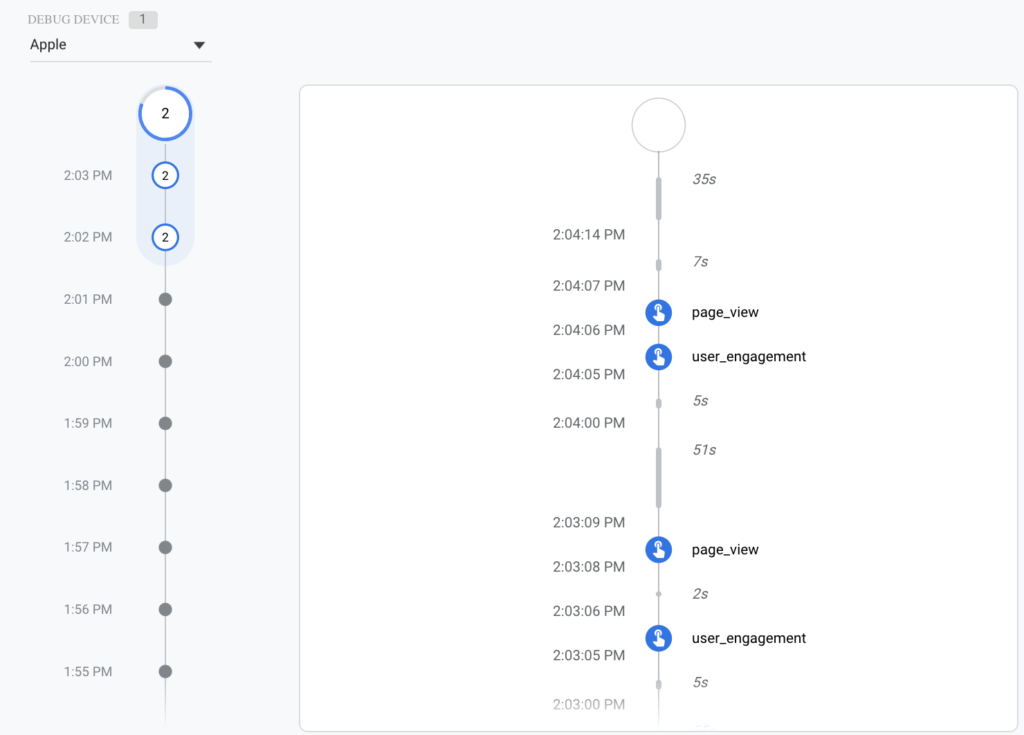
If you’re using a Mac, like me, you’ll see a new debug device called “Apple” appear, and data will start flowing into the report (sometimes I need to refresh GA4 to see my device).
How to Enable Debug Mode on an Android App
Apps are more tricky than websites because developers have various tools that they can use to create and distribute test versions of an app. The following instructions assume your dev team can provide you with an .apk file, because that seems to be the most common for Android.
Step One is to install Android Studio and set up an emulator if you haven’t already. Google’s documentation is okay, but if you are struggling with this, I highly recommend the LinkedIn Learning course “Android Studio Essential Training” by David Gassner.
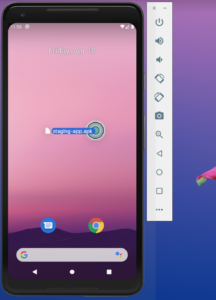
Once you have the emulator open, you can just drag the .apk file to install the staging app, as shown in the screenshot below.
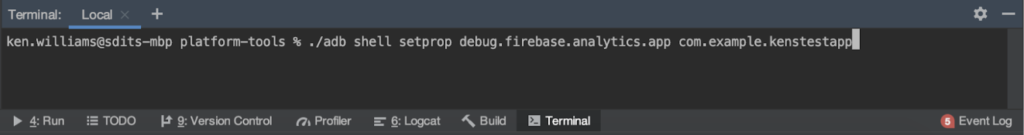
Step Two is to use the terminal window in Android Studio to navigate to the “/sdk/platform-tools/” directory. Here, you can execute the following command to enable debug mode:
./adb shell setprop debug.firebase.analytics.app
Example:
Step Three is to open the app in the emulator and take a look at the DebugView report. After about 30 seconds, you should see a new device logging events.
How to Enable Debug Mode on an iOS App
UPDATE (Nov 13, 2020):
Adding code snippets thanks to a contribution by Scott Gruby.
The following instructions assume your dev team uses TestFlight to distribute test versions of the app because that seems to be the most common for iOS.
Step One: The official documentation from Google suggests that you specify the -FIRDebugEnabled command-line argument in Xcode. If you are an app developer working in Xcode, this will be sufficient, but once you build the app for TestFlight, it will be removed, and Debug Mode will not be activated.
The solution to this problem is to set the runtime flags when the app is started. To do this, add the following to your application:didFinishLaunchingWithOptions: or override AppDelegate’s init
var args = ProcessInfo.processInfo.arguments
args.append("-FIRDebugEnabled")
ProcessInfo.processInfo.setValue(args, forKey: "arguments")
To go a step further, you may add a hidden debug screen with a flag to enable/disable the firebaseDebug UserDefault. Then, you can modify the code above to check this value on startup, like so:
#if DEBUG || STAGING
if UserDefaults.standard.bool(forKey: "firebaseDebug") == true {
var args = ProcessInfo.processInfo.arguments
args.append("-FIRDebugEnabled")
ProcessInfo.processInfo.setValue(args, forKey: "arguments")
} else {
var args = ProcessInfo.processInfo.arguments
args.append("-FIRDebugDisabled")
ProcessInfo.processInfo.setValue(args, forKey: "arguments")
}
#endif
BEWARE: Do not forget to remove this before publishing your app!
Step Two: Once the app developers have made the modification above, install the TestFlight app on your iOS device, and then open the invitation email you received from TestFlight and click the links to download the test app.
At this point, all you need to do is open the test app and wait 60 seconds for data to start populating in the DebugView report.

.png)